AI · interactive system maps
AI Architecture Diagram Generator
Turn a description — or your own docker-compose, Terraform, Kubernetes, or SQL — into a polished, interactive system map you can explore, present, and share as one HTML file.
Every map is auto-checked for clean layout before you ever see it — checked, never guessed.
- ✓Open it and present — search, trace routes, dark/light
- ✓Map what you already run — paste compose / Terraform / K8s / SQL
- ✓Grounded exploration — never invents topology
- ✓One file to share — self-contained HTML + PNG/SVG


Sign-in includes 10 free credits — no card.
Search nodes, trace request routes, switch light/dark, then export a self-contained HTML file that stays interactive for anyone you send it to.
From docker-compose, Terraform, Kubernetes, or SQL to a map
Paste a file you already have — the type is detected automatically, and everything it defines becomes an explorable node with its real connections. Nothing is invented.
Services, images, and depends_on chains — your web/worker/db topology exactly as it runs.
resources, subnets, instances, and managed stores — the declared shape of your infrastructure.
Deployments, Services, and Ingresses — how the cluster's workloads actually connect.
CREATE TABLE statements become entities, with foreign keys drawn as real relationships.
Map types: architecture, dataflow, sequence
Pick a type above the input — or just describe your system and let Auto mode detect it. All three types share the same exploration (search, route tracing, themes) and the same one-file HTML export.
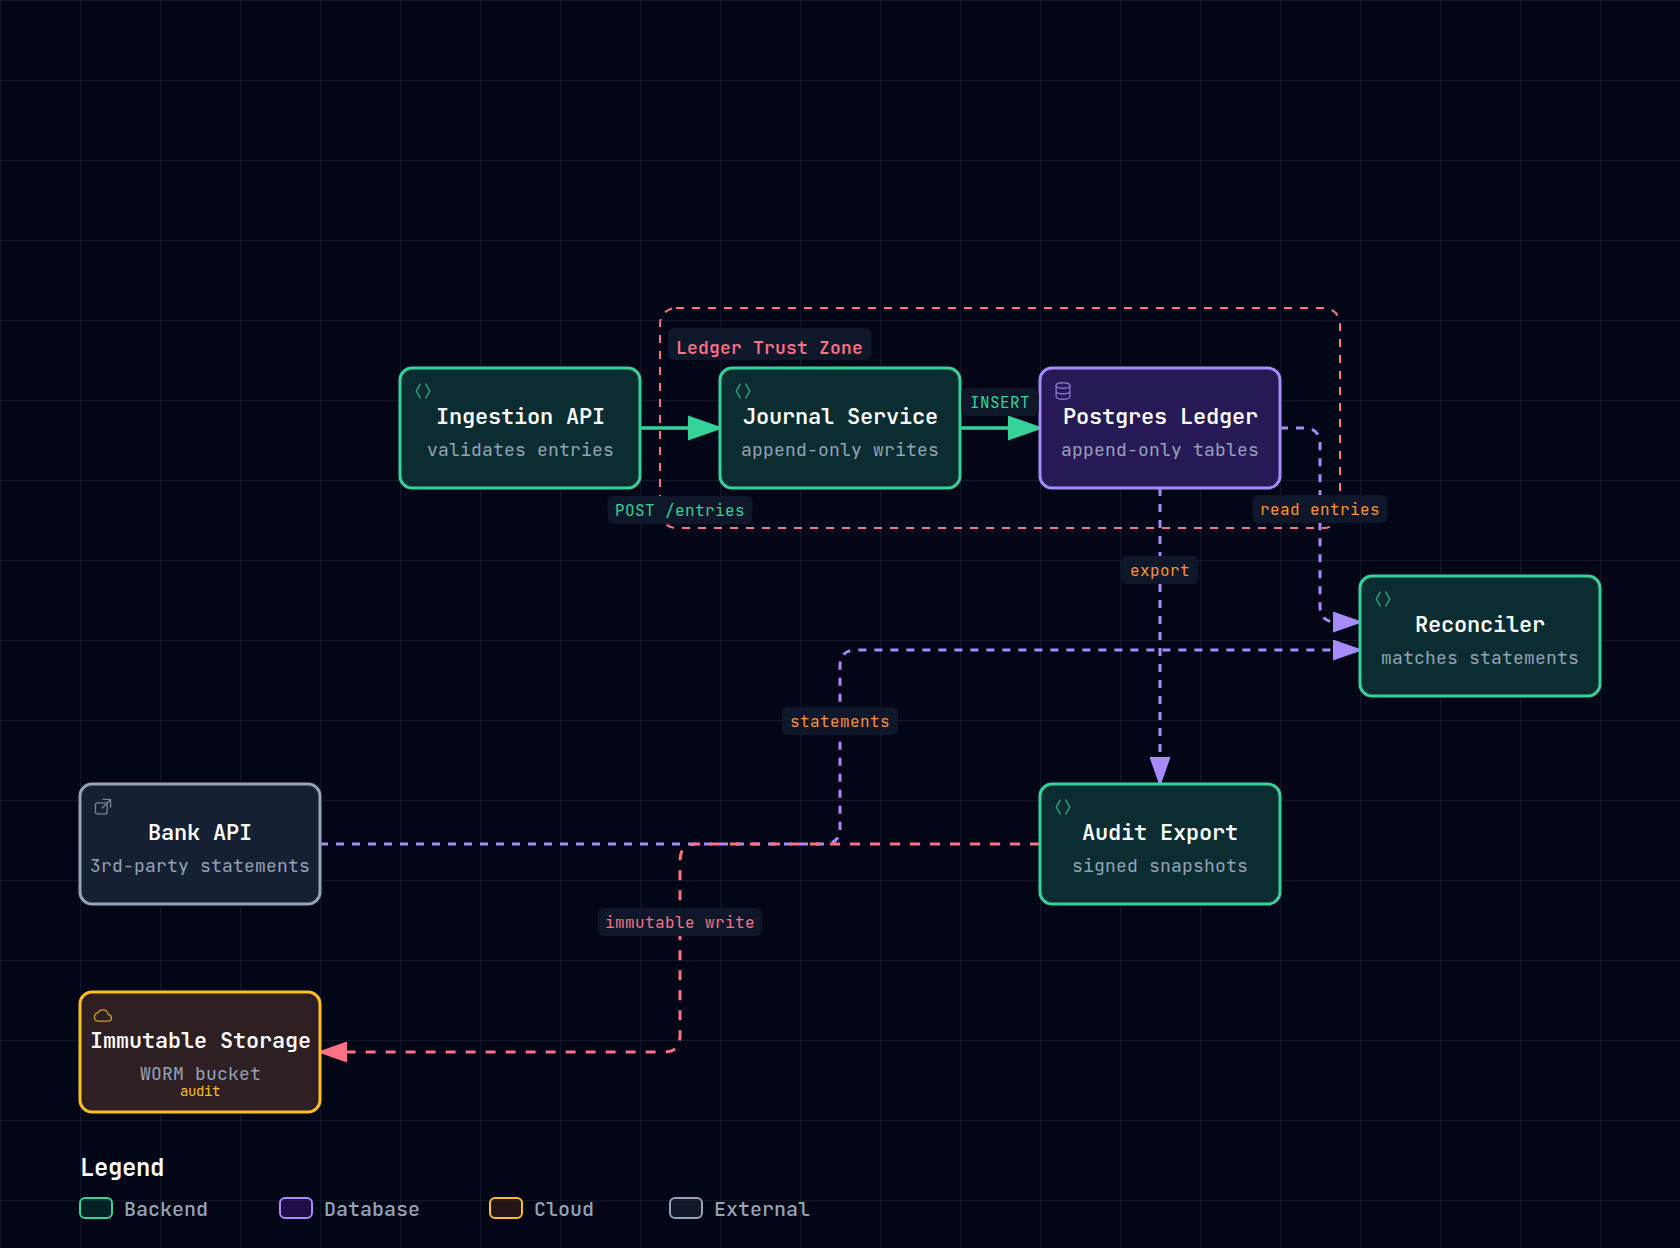
What the system is made of — components, services, stores, trust-zone boundaries, and the main request path. Paste docker-compose, Terraform, Kubernetes, or SQL (above) to map what you already run.
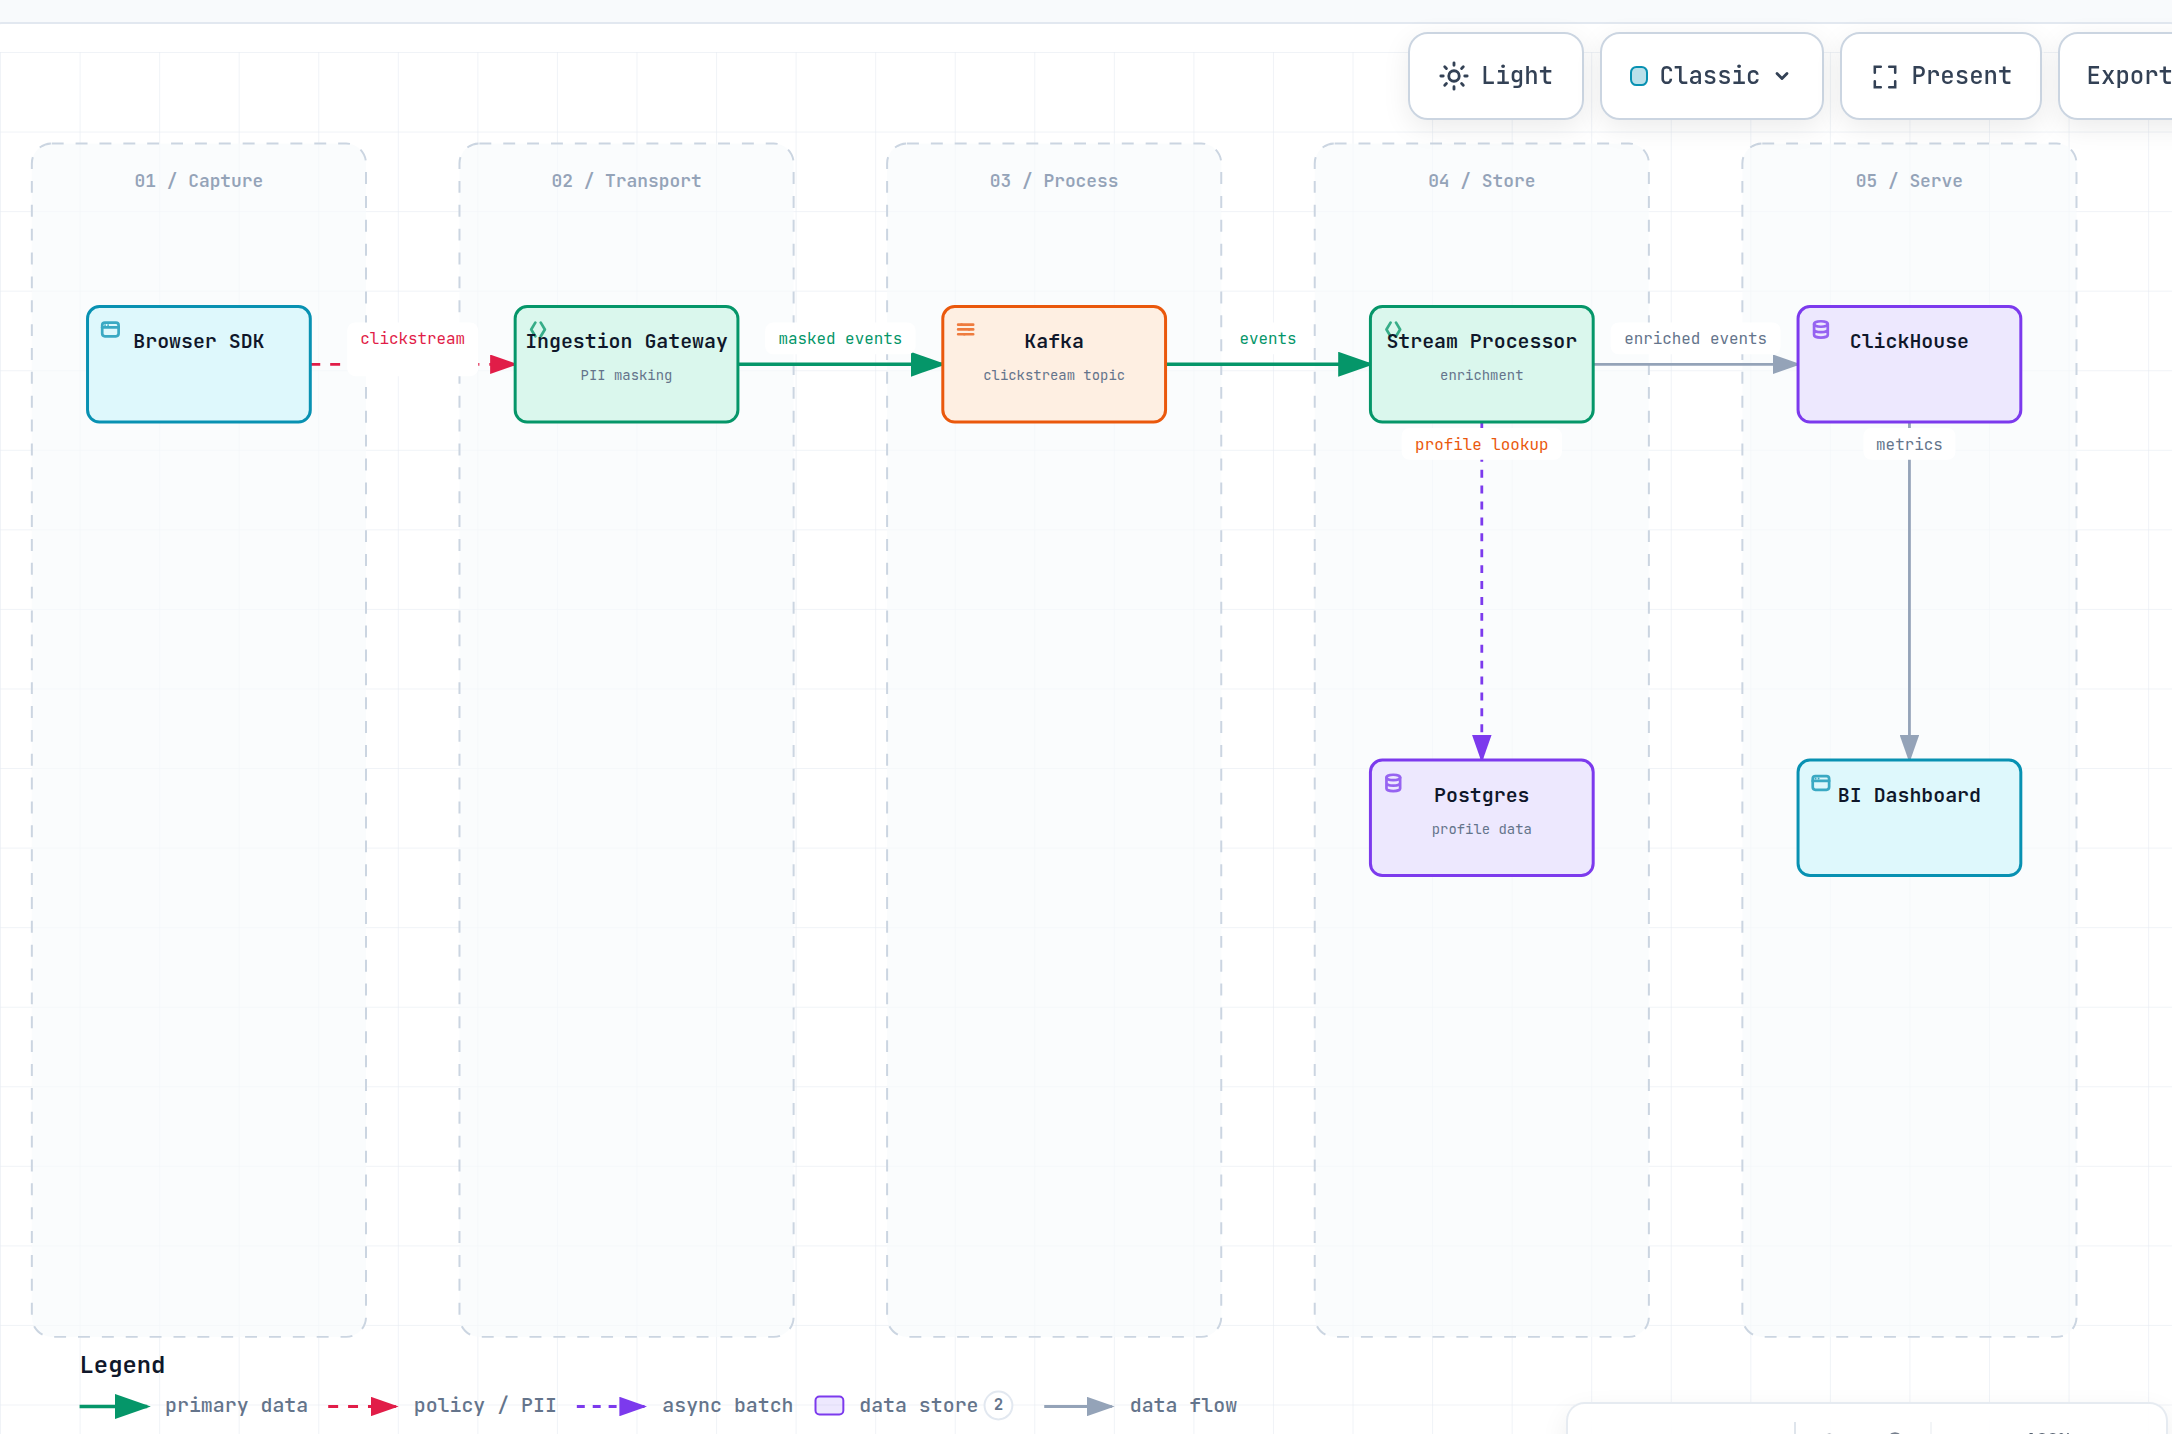
A data flow diagram laid out as ordered stages — Capture → Transport → Process → Store → Serve — with the data payload labeled on every flow and PII or batch hops marked.
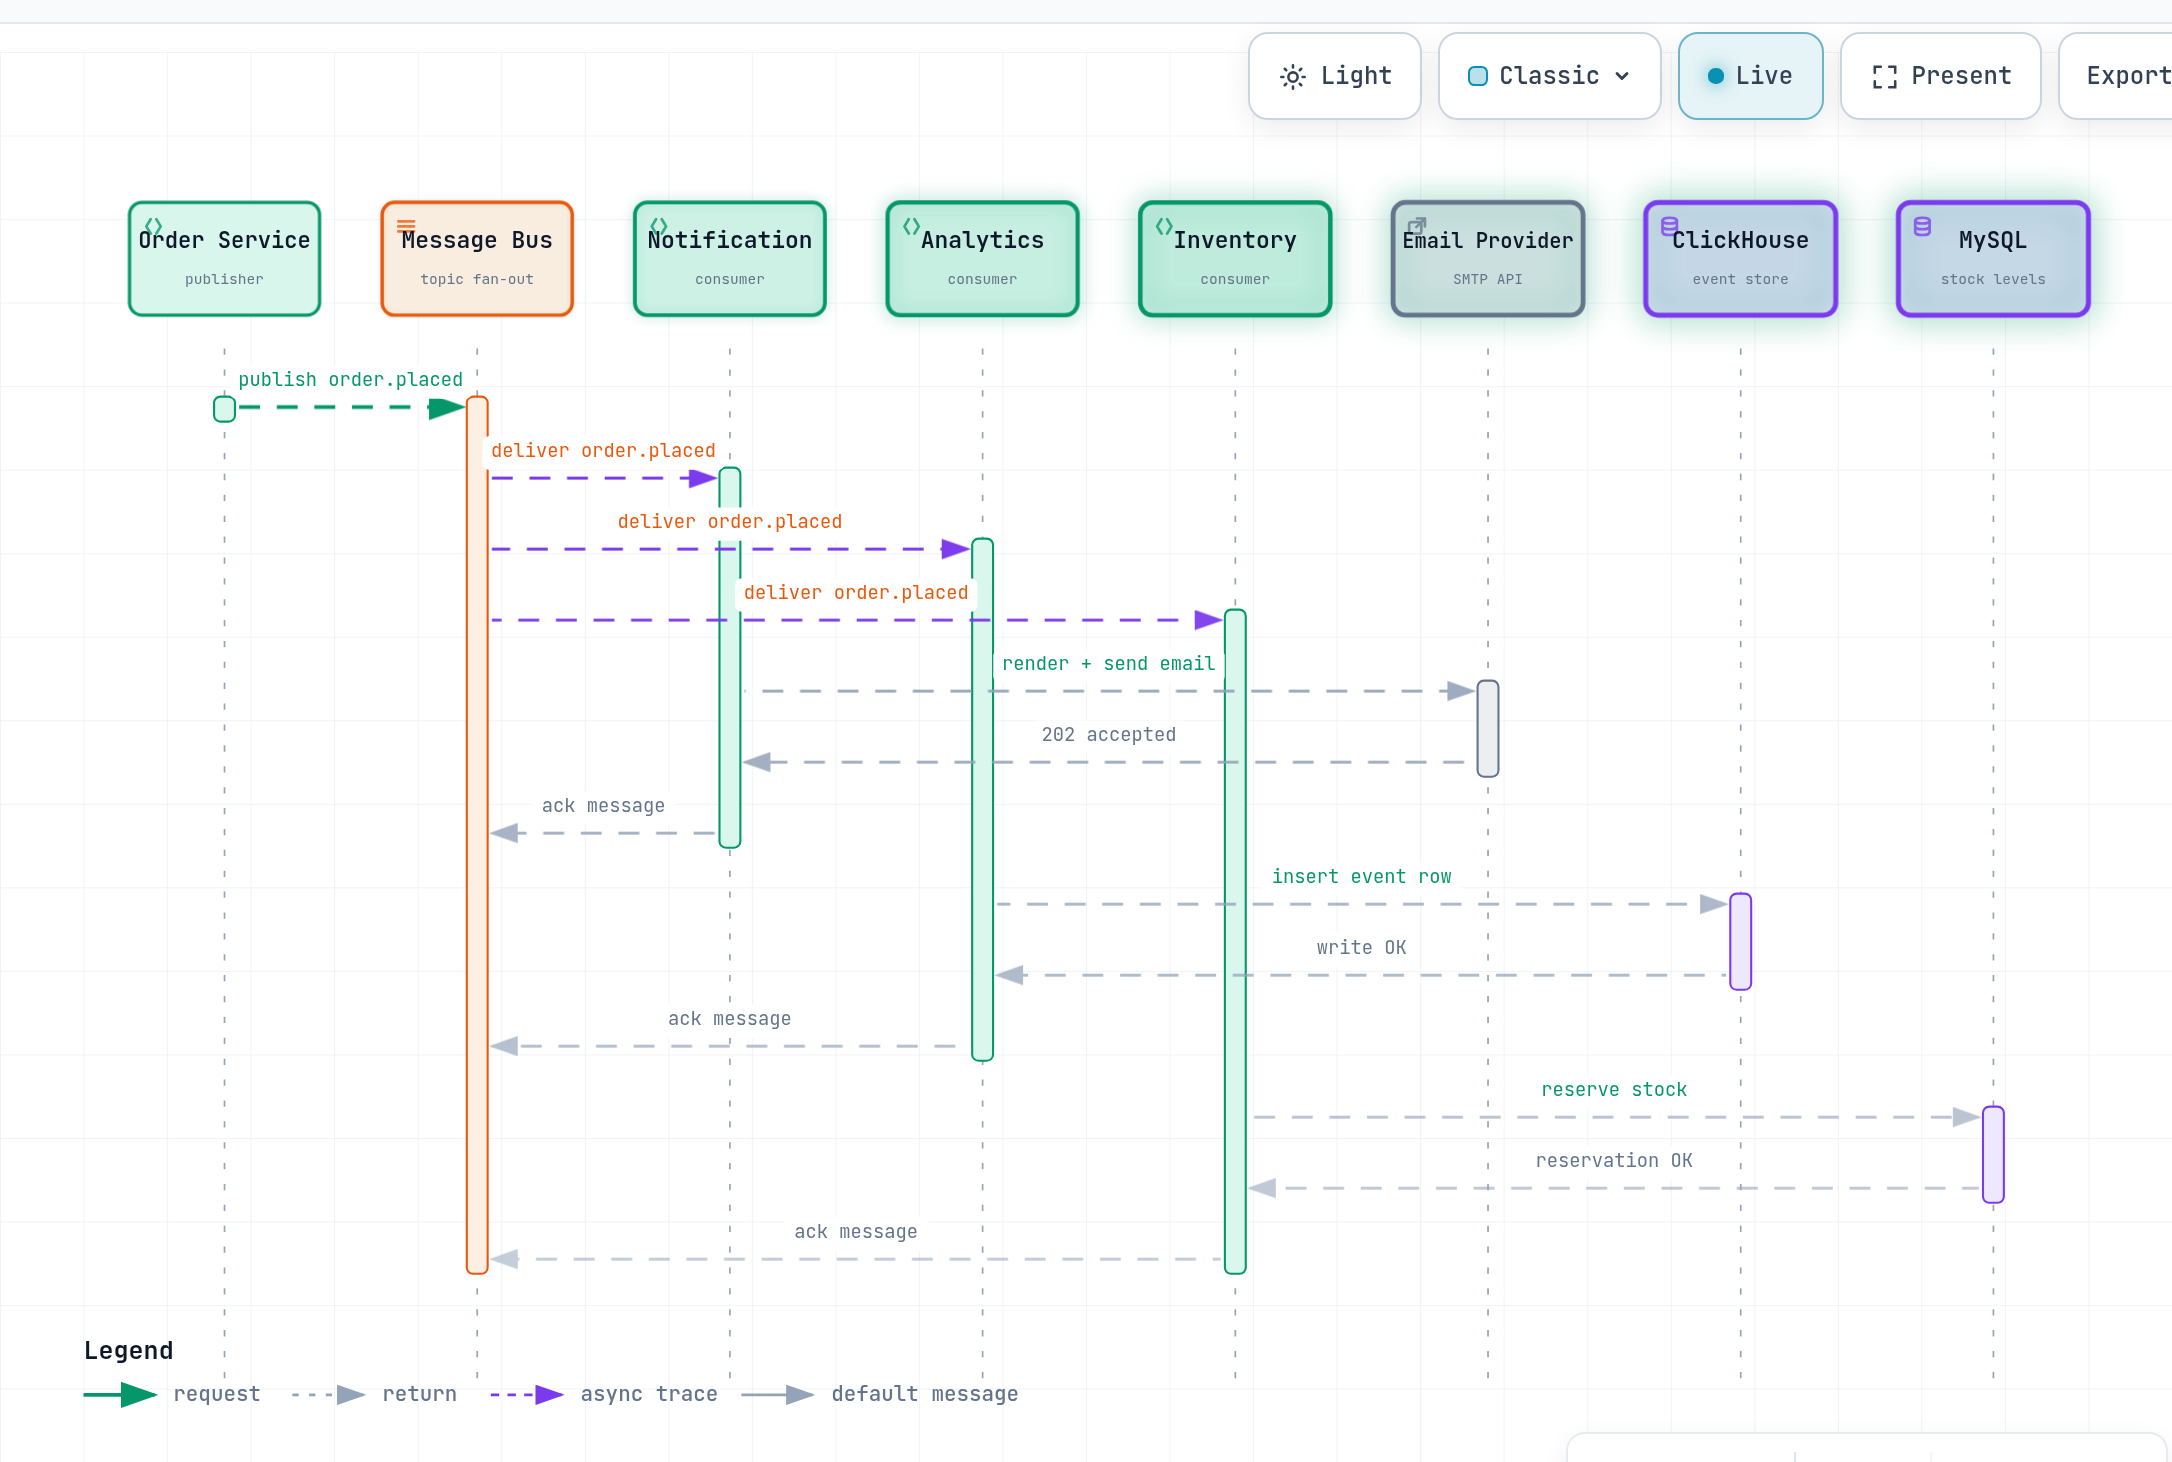
Who calls whom, in order — requests, replies, and async callbacks on a timeline with activation bars, credential crossings marked, and every message labeled.
Diagram code, or a system map?
Two workspaces, two questions. Pick by the question you are answering — each opens in its own focused page.
Login flows, order lifecycles, API sequences, ER diagrams — anything you want as editable Mermaid code and a crisp export. 3 credits.
Open the diagram code workspace →Components, services, stores, trust boundaries, the main request path — mapped as an explorable, shareable architecture map. 5 credits. That is this page.
Why the maps look right
AI-generated diagrams have a reputation: overlapping boxes, tangled lines, a picture nobody can read. This tool is built so that can't ship.
The AI plans where every component sits, and the renderer follows that plan exactly. Overlaps and tangles are caught and repaired automatically — free — before you see them.
Trust-zone boundaries, typed components (databases, queues, gateways), and the main request path are first-class — semantics flowchart syntax can't express.
Search nodes, trace request routes, switch light/dark — then export one self-contained HTML file where all of that keeps working offline.
How it works
Write what the system is, or paste Mermaid, docker-compose, Terraform, K8s, or SQL.
The model designs the structure and layout; validation catches and auto-repairs anything unclear.
Search and focus nodes, trace request routes, compare roles, switch themes.
Download a self-contained HTML file, or export a crisp PNG/SVG.
Other AI tools
Describe a process — flowcharts, sequence, ER, state — and get editable Mermaid code. Screenshots work too.
Open →Screenshot to Mermaid3 creditsDrop a screenshot or hand-drawn sketch and get the same editable Mermaid code.
The same tool as Text to Mermaid, opened on the image tab.
Open →Curious how this relates to the 65,000-star GitHub project? Read how we ported the Archify engine to your browser.
Get more maps
Everyone gets 10 free credits after signing in (each architecture map uses 5, repairs are free). For more, subscribe to Pro for a monthly AI allowance plus unlimited premium theme exports, or buy a one-time credit pack.
- ✦ Unlimited premium theme exports — all 7 Advanced styles
- ✦ 200 AI credits every month (≈40 interactive maps, or mix with the other tools)
- ✦ Every AI tool on one allowance: maps, text & screenshot to Mermaid, edit & fix
- ✦ Free auto-repair rounds — a map that fails validation never costs you credits
- ✦ Cancel anytime
FAQ
Questions about the AI architecture generator
How do I generate an architecture diagram with AI?
Describe your system in plain language — the parts, what talks to what, where data lives — or paste an existing Mermaid flowchart, a docker-compose file, Terraform, Kubernetes manifests, or a SQL schema. The AI designs a structured plan of your system, and your browser renders it as an interactive map you can search, trace, and export. Each map costs 5 credits; repair rounds are free.
What makes this different from a normal diagram generator?
The output is not a flat picture. It is an explorable system map: focus any node to trace upstream and downstream dependencies, follow exact request routes, compare roles, and switch light/dark themes. You can download one self-contained HTML file where all of that keeps working — even offline.
How much does it cost?
Every architecture map uses 5 credits. New accounts get 10 free credits (two maps), Pro includes 200 credits a month, and one-time credit packs never expire. If the same input is regenerated within a week it comes from your cache at no charge, and validation repairs never cost credits.
Is my system description private?
Your description or file is sent to our AI provider to design the map — that part cannot run locally. The rendering, exploring, and exporting all happen in your browser, and the generated structure is only cached server-side for seven days (keyed to your account) so regenerating the same map is free. It is never used for training and never shared.
Can I edit the generated map?
Change your description and generate again — same input within the cache window is free. You can also restore the previous map after a regeneration. Direct editing of the generated structure is on the roadmap.
Do exports work without your site?
Yes. The HTML export embeds the complete interactive viewer, fonts included. Send it to a teammate or open it from disk years later — search, route tracing, themes, and PNG/SVG export all still work with no network connection.
How is this different from asking ChatGPT for a diagram?
ChatGPT draws a flat picture with whatever layout it guessed, and a big system picture is exactly where flat pictures fail — you can't search a node, trace a request route, or hand it to someone to explore. Here the layout is planned and validated before it's drawn, the architecture semantics (boundaries, component types, the main path) are first-class, and the export stays interactive offline.
Can I generate dataflow diagrams?
Yes — describe the pipeline and pick Dataflow above the input. Auto mode also recognizes pipeline descriptions on its own (words like Kafka, ETL, ingestion) and routes them there. The map lays the pipeline out as ordered stages with the data payload labeled on every flow (PII and batch hops marked), and the same exploration and one-file HTML export apply. Dataflow maps cost the same 5 credits.
Can I generate sequence diagrams?
Yes — describe who calls whom (an API request, an OAuth login, a webhook retry) or paste a Mermaid sequenceDiagram, and pick Sequence above the input. Auto mode also recognizes interaction descriptions on its own (words like request/response, callback, cache miss) and routes them there. The map lays the messages out as an ordered timeline with activation bars and return paths marked quieter, and the same exploration and one-file HTML export apply. Sequence maps cost the same 5 credits.